Introduction
This plugin is a modified version from Qdb
Features
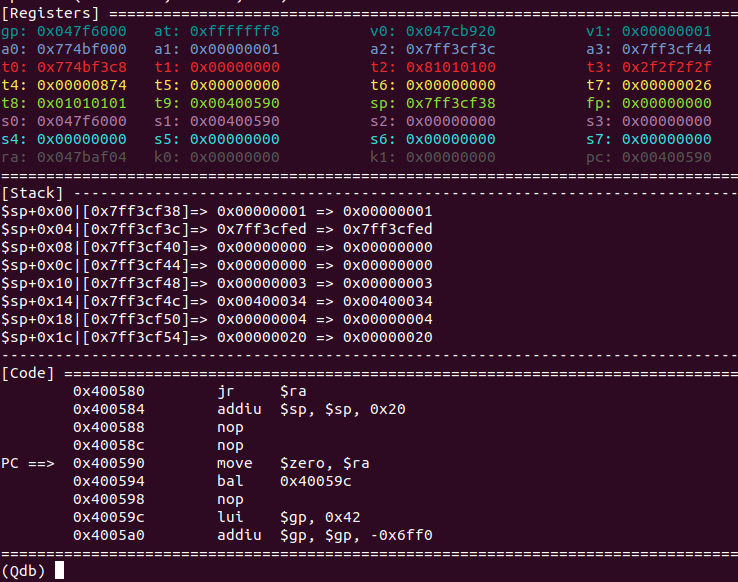
- commandline-based user interface
-
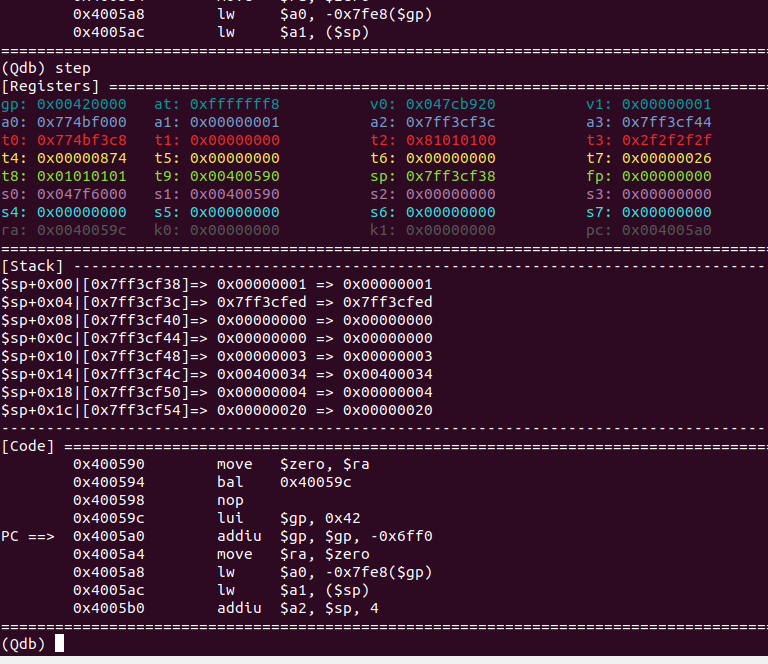
step-by-step execution
-
use command
steporsto execute one instruction at a time
-
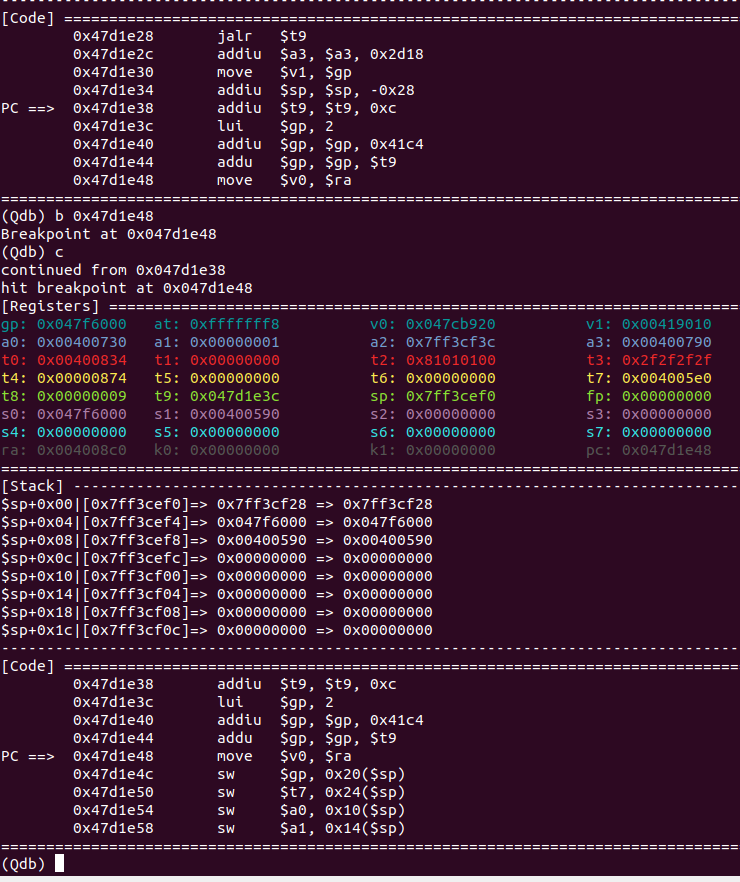
breakpoints
-
use command
breakpointorbto setup a breakpoint, and continue execution withcontinueorc
-
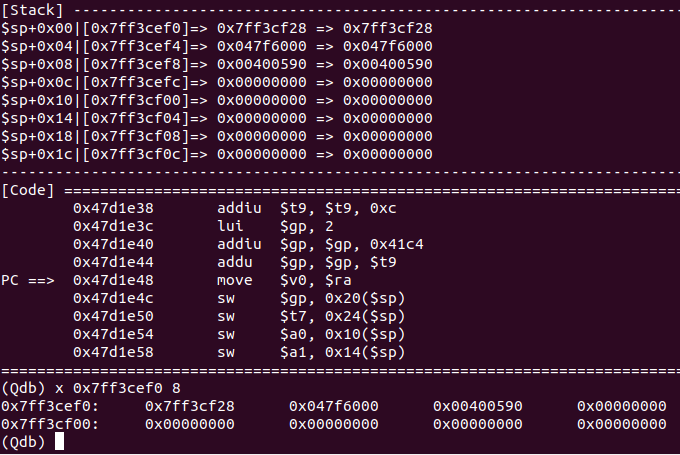
dynamic memory examination
-
use command
examineorxto read data from memory
-
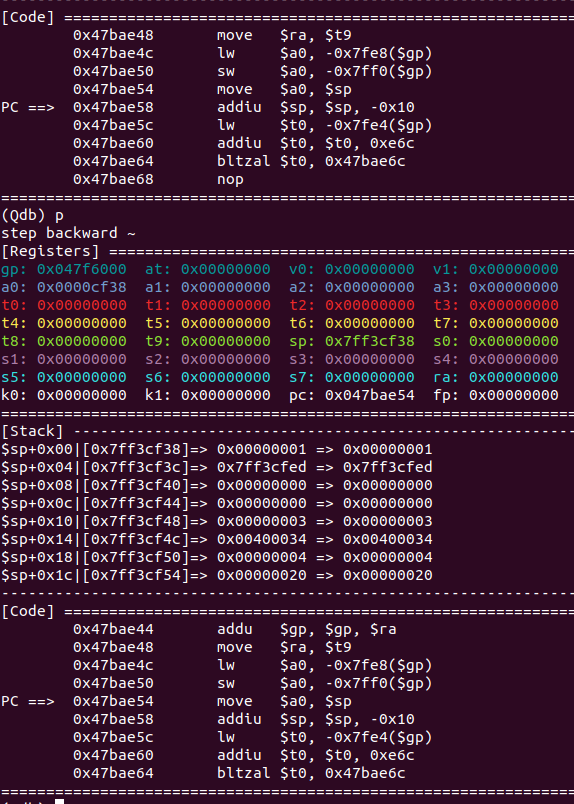
record and replay
-
use command
backwardorpto step backward from current location - Note:
-
- the address you want to step backward on it must be step-over before
-
- make sure run qdb with option
rr=True
- make sure run qdb with option
-
Usage
Qdb can be enabled with ql.debugger = "qdb". Available options are "qdb::rr" to enable qdb and switch on record and replay and "qdb:0x1030c" to enable qdb and setup a breakpoint at 0x1030c.
Example
from qiling import Qiling
from qiling.const import QL_VERBOSE

if __name__ == "__main__":
    ql = Qiling([r'rootfs/arm_linux/bin/arm_hello'], r'rootfs/arm_linux', verbose=QL_VERBOSE.DEBUG)

    ql.debugger = "qdb" # enable qdb without options

    # other possible alternatives:
    # ql.debugger = "qdb::rr" # switch on record and replay with rr
    # ql.debugger = "qdb:0x1030c" # enable qdb and setup breakpoin at 0x1030c

    ql.run()